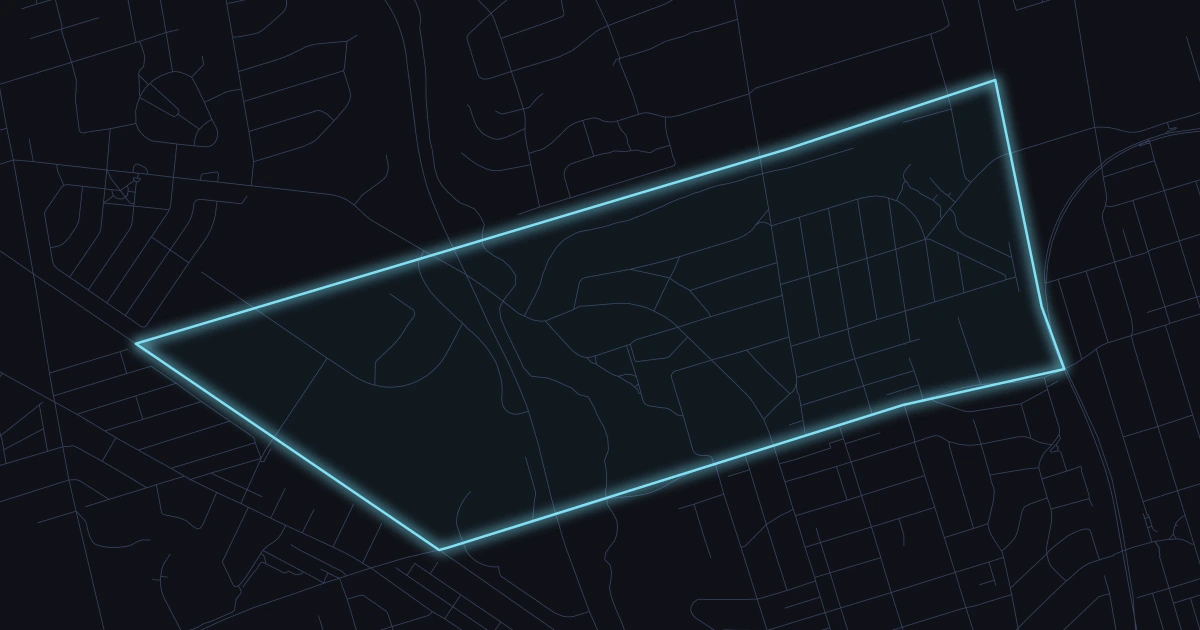
View recent reported crimes in Beechborough-Greenbrook, including crime type breakdowns,
monthly trends, and the latest loaded incidents from Toronto Police open data.
Latest incident
Oct 22
6 days ago
Last 7 days
3
.
Last 30 days
9
.
Last year
136
.
Alerts
Notify me when there is a crime in this area
Safety snapshot
Is Beechborough-Greenbrook safe?
Reported crime data alone cannot establish personal safety. Beechborough-Greenbrook recorded 136 reported crimes in the 365-day period Oct 26, 2025 – Oct 26, 2026, ranking 26 of 158 Toronto neighborhoods from fewest to most reported incidents, including 9 in the last 30 days. That is 21.7 reported incidents per 1,000 residents using the 2021 census population of 6,260. This does not adjust for visitors or population changes since 2021. Read the offence breakdown and local map alongside these totals.
Spatial view
Beechborough-Greenbrook incident map
30-day markers
9
Showing 9 geocoded crimes from the last 30 days in Beechborough-Greenbrook.
High harm Violence Property Other
Compare places
How does another area compare?
See reported incidents and offence types side by side, using the same police source and time period.
Auto TheftParking LotBeechborough-Greenbrook (112)
Auto Theft
Mar 8, 2026, 10 p.m.
Near Trethewey Dr / Greentree Crt
D12 GO-2026500961
Auto TheftHouseBeechborough-Greenbrook (112)
Sexual Violation
Mar 7, 2026, 12 a.m.
D12 GO-20262161980
Sexual ViolationApartmentBeechborough-Greenbrook (112)
Theft from Motor Vehicle
Mar 6, 2026, 8 a.m.
Near Ray Ave / Industry St
D12 GO-2026550372
Theft from Motor VehicleOutsideParking LotBeechborough-Greenbrook (112)
Auto Theft
Mar 6, 2026, 9 p.m.
Near Trethewey Dr / Clearview Hts
D12 GO-2026483580
Auto TheftApartmentBeechborough-Greenbrook (112)
Theft over $5,000
Feb 26, 2026, 9 a.m.
Near Lester Ave / Keele St
D12 GO-2026419247
Theft over $5,000OtherPrivate Property StructureBeechborough-Greenbrook (112)
Monthly trend
Monthly totals
Latest incident
Oct 22
8
Nov
5
Dec
8
Jan
14
Feb
9
Mar
14
Apr
11
May
19
Jun
16
Jul
14
Aug
7
Sep
9
Oct
Offense mix
Offences in the past year
Categories
9
Assault
66
Auto Theft
22
Sexual Violation
13
Theft from Motor Vehicle
13
Break and Enter
10
Bike Theft
6
Theft over $5,000
6
Robbery
4
Calls for service
Recent Calls to 911
Shown
10
UNKNOWN TROUBLE
TRETHEWEY DR - GREENTREE CRT
FRAUD
BLACK CREEK DR - TODD BAYLIS BLVD
ARREST
GABIAN WAY - VENN CRES
FOUND PROPERTY
BLACK CREEK DR - TODD BAYLIS BLVD
DAMAGE
BLACK CREEK DR - TODD BAYLIS BLVD
THEFT
BLACK CREEK DR - TODD BAYLIS BLVD
ARREST
BLACK CREEK DR - TODD BAYLIS BLVD
ARREST
BLACK CREEK DR - TODD BAYLIS BLVD
HOLDING LOST ELDERLY
BLACK CREEK DR - TODD BAYLIS BLVD
THEFT
Nearest intersection not listed
Safety questions
Is Beechborough-Greenbrook safe?
Is Beechborough-Greenbrook safe?
Reported crime data alone cannot establish personal safety. Beechborough-Greenbrook recorded 136 reported crimes in the 365-day period Oct 26, 2025 – Oct 26, 2026, ranking 26 of 158 Toronto neighborhoods from fewest to most reported incidents, including 9 in the last 30 days. That is 21.7 reported incidents per 1,000 residents using the 2021 census population of 6,260. This does not adjust for visitors or population changes since 2021. Read the offence breakdown and local map alongside these totals.
What crimes are most common in Beechborough-Greenbrook?
The most reported crime categories in Beechborough-Greenbrook over the last year are Assault (66), Auto Theft (22), Sexual Violation (13).
How many break-ins happened in Beechborough-Greenbrook recently?
1 break and enter incidents were reported in Beechborough-Greenbrook in the last 30 days, and 10 over the last 365 days.
How current is this Beechborough-Greenbrook crime data?
This page is regenerated from Toronto Police Service open data. The most recent loaded incident in Beechborough-Greenbrook occurred on Oct 22, 2026.
How does recent reported crime in Beechborough-Greenbrook compare with earlier weeks?
9 incidents were reported in the latest 30-day window (Sep 26, 2026 – Oct 26, 2026), averaging 0.3 per day. The preceding 60 days had 21 reports, averaging 0.4 per day. These are different-length periods, so compare daily averages. Reporting delays can lower the latest figures; this is not a forecast.
Which area does the Beechborough-Greenbrook data cover?
Official City of Toronto neighborhood boundary for Beechborough-Greenbrook.